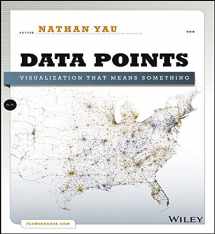
Data Points: Visualization That Means Something
Book details
Summary
Description
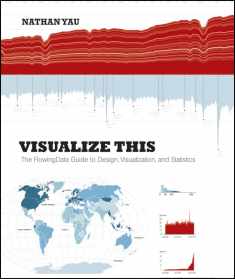
A fresh look at visualization from the author of VisualizeThis
Whether it's statistical charts, geographic maps, or the snappygraphical statistics you see on your favorite news sites, the artof data graphics or visualization is fast becoming a movement ofits own. In Data Points: Visualization That Means Something,author Nathan Yau presents an intriguing complement to hisbestseller Visualize This, this time focusing on thegraphics side of data analysis. Using examples from art, design,business, statistics, cartography, and online media, he exploresboth standard-and not so standard-concepts and ideas aboutillustrating data.
- Shares intriguing ideas from Nathan Yau, author of VisualizeThis and creator of flowingdata.com, with over 66,000subscribers
- Focuses on visualization, data graphics that help viewers seetrends and patterns they might not otherwise see in a table
- Includes examples from the author's own illustrations, as wellas from professionals in statistics, art, design, business,computer science, cartography, and more
- Examines standard rules across all visualization applications,then explores when and where you can break those rules
Create visualizations that register at all levels, with DataPoints: Visualization That Means Something.


We would LOVE it if you could help us and other readers by reviewing the book

